Stribeck Curve
Interpretation of the individual zones
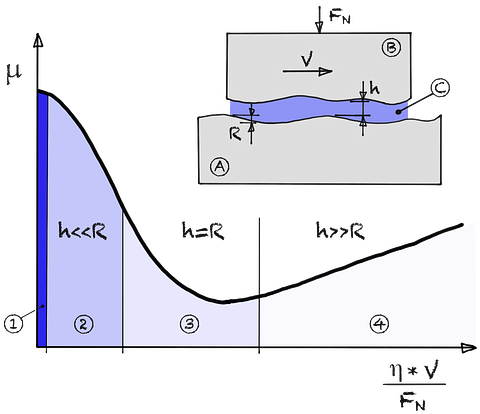
① Solid body friction: In this area, the distance (h) between the friction partners is much smaller than the roughness (R). High coefficient of friction μ due to the direct contact between rough surfaces (A) and (B).
② Boundary friction: The distance (h) corresponds approximately to the roughness (R). Significant reduction of the friction coefficient μ due to a thin lubricating film (C) that partially separates the surfaces.
③ Mixed friction: The distance (h) slightly exceeds the roughness (R). Minimum coefficient of friction μ, because the lubricating film is fully developed and separates the surfaces.
④ Fluid friction: Here the distance (h) is much larger than the roughness (R). Increase in the coefficient of friction due to increasing viscosity influences at very high speeds and thick lubricating films (C).