Forming Limit Diagram FLD
2.1
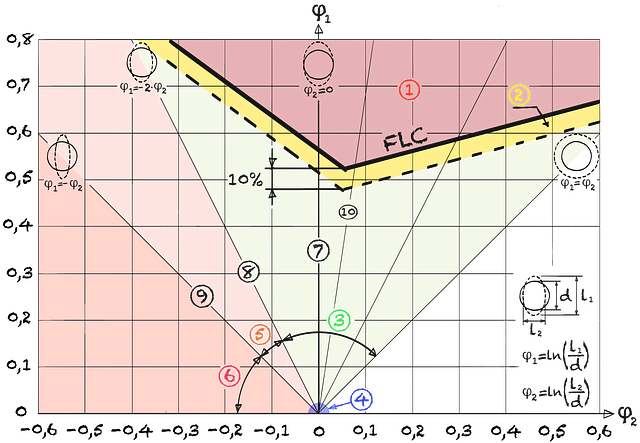
Fig. 1
Forming limit diagram FLD and limit curve FLC19
① Crack zone ② Border area ③ Safe zone ④ Elastic area ⑤ Fold area ⑥ Fold area ⑦ Plain-strain ⑧ Uniaxial draw ⑨ Deep drawing ⑩ Embossing
① Above the flow limit curve FLC, cracks appear in the sheet metal.
② Zone of strong elongation is the limit area of material stress that leads to constrictions.
③ “Safe Zone”: Elements will not “fail” and have no increased tendency to wrinkle.
④ Elongation in the elastic area is often the cause of spring back.
⑤ Strong tendency to form wrinkles or visible marks on the surface (rough, porous). The sheet thickness is smaller than the original sheet thickness.
⑥ Strong tendency to form wrinkles or visible traces on the surface (rough, porous). The sheet thickness is greater than the original sheet thickness.
⑦ Tensile stresses in the length direction φ1 without a change in strain in the width direction φ2 (but in the thickness direction φ3 ) are called “confined draw” or “plain strain”.
⑧ Single-axle draw
⑩ Embossing of round embossings and corner areas20
There is general agreement that the position of the limit curve FLC depends on factors such as material, sheet thickness, anisotropy, strain hardening exponent, lubricant used, forming speed, test method and sample shape. In addition, the forming limit diagram is only valid for a constant ratio of the principal stresses, whereby the forming history, ie the forming path, is not taken into account.14
14
Doege, E.; Breidohr, B. / EFB-Forschungsbericht Nr. 35: Untersuchungen zum Tiefziehen von Teilen mit unebenen Bodenformen / Europäische Forschungsgesellschaft für Blechverarbeitung e. V. / Hannover / 1988 / …
19
Lange / Umformtechnik Blechbearbeitung / Springer Verlag / Berlin / 1990 / 2. Auflage
20
Wolf, H.; Kluge, S. / Spannungs- und Formänderungsuntersuchungen beim Hohlprägen von Formfeldern / Umformtechnik 20 / Zwickau / 1986 / …