Optimize True Strain
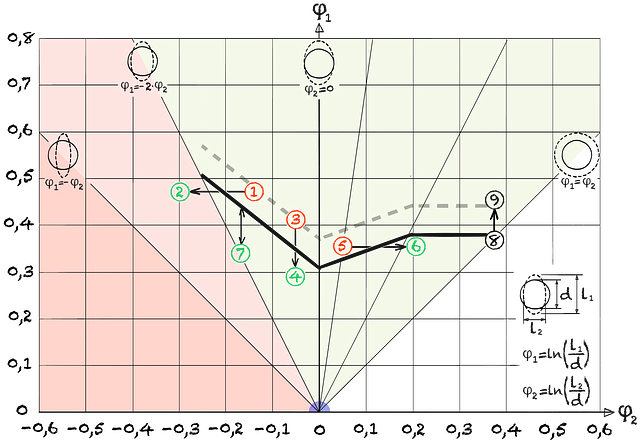
The points ① - ⑦ show possible points in the deformation diagram. ⑦ is below the limit curve. The distance to the FLC is a measure of the deep drawing safety at this point.
If the values are above the flow limit curve, they can be optimized through various measures:
① to ② Superimpose additional compressive stresses in φ2
③ after ④ Decrease natural strain
⑤ to ⑥ Increase in the degree of deformation through additional stretch-forming components in direction φ2
Optimisation can be achieved by changing the blank dimensions, arrangement and shape of the drawing rods, dies or punch edge radius, lubrication, material or shape of the tool.19
⑧ to ⑨ The flow limit curve FLC can be increased by using thicker sheets or sheets with a higher hardening exponent ( n-value ). Likewise, tempering the tool or the circuit board can shift the FLC upwards.